visuale.com.au

Over 12+ years data wrangling, storytelling & visualising in the enterprise & emerging tech space.
Building things that last
...by breaking them in stealth.
Download CV/Resume
Microsoft Certified
Google Certified
My Github
My LinkedIn
PowerBI & Fabric
My journey : On a transition journey from Tableau to PowerBI I thought I’d detour into the data engineering space. Here is my journey from building custom visuals, negotiating with DAX and picking up other query languages besides SQL (NoSQL, Spark and KQL).
Data engineering is
Learning by breaking things is probably one of the most natural (and sometime Frightstrating - frightening and frustrating) way to learn. Data engineering is one of them. I picked up NoSQL for the first time this year and its not like a racket sport you can pick up just because you got good at the last one. In MongoDB for example, it was not obvious that .find and .aggregate were 2 different scope of operations which led to a lot of disappointing experiences.
The below code pretty much sums up my early experience working without schema
db.I.find({ workingSchemaless: "quitelibreating" })
db.I.find({ workingSchemaless: "chaotic" })
If you only need to find documents, use .find. If you need to chain operations (like grouping or transforming), $match becomes part of the broader aggregation pipeline.
That was until I found aggregation stage / pipelines. If aggregation is to ETL what find is to filtering (limited to basic retrieval).
db.Collection.updateOne({ _id: "myMind" }, { $set: { blown: true } })
If you only need to find documents, use .find. If you need to chain operations (like grouping or transforming), $match becomes part of the broader aggregation pipeline. As a web developer in a previous life there was an aha moment as soon as you understood the gotchas.
‘Fluent 2’ design system in Fabric
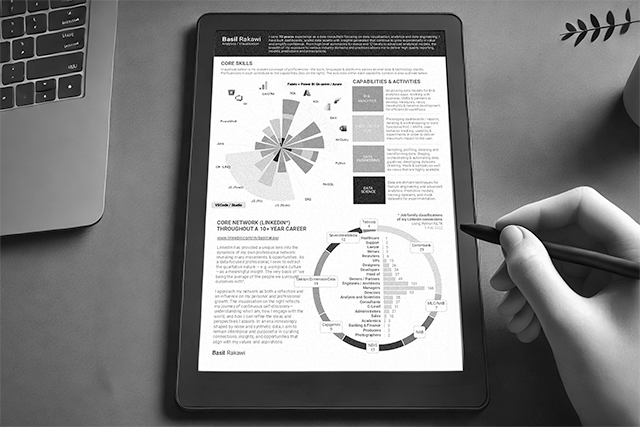
The design cues in Fabric looks to be forging its own path. There are some inspirational patterns to borrow for a couple of visualisation projects I have in mind - specifically as e-paper data visuals.
